Prompt-Injection Detector Benchmark
Scope
This benchmark evaluates prompt-injection classifiers under a common, versioned scoring procedure.
The evaluation covers three practical dimensions:
- detection of direct prompt-injection attempts;
- detection of indirect instructions embedded in external content;
- false-positive behavior on non-malicious, real-world inputs.
This benchmark is open for updates, reproducible (run-it-yourself) and published on Github.
Disclosure and audit status
Conflict-of-interest disclosure
This benchmark is maintained by Bastion Soft, which also develops one of the evaluated detectors.
To reduce the risk of preferential treatment:
- all evaluated models use the same published scoring pipeline;
- model versions and configuration details are recorded;
- dataset snapshots and benchmark code are versioned;
- methodology changes are documented in the release history.
Rankings
| Detector↕ | Direct avg AUC▼ | Direct avg F1@0.5↕ | Indirect avg AUC↕ | Indirect avg F1@0.5↕ | FPR@0.5 (real traffic)↕ |
|---|---|---|---|---|---|
| bastion-prompt-protection | 0.991 | 0.943 | 0.952 | 0.835 | 1.24% |
| sentinel | 0.955 | 0.858 | 0.823 | 0.603 | 23.60% |
| wolf-defender | 0.954 | 0.893 | 0.865 | 0.728 | 24.03% |
| hlyn judge | 0.950 | 0.708 | 0.765 | 0.316 | 21.53% |
| wolf-defender-small | 0.941 | 0.877 | 0.825 | 0.651 | 28.79% |
| meta prompt-guard v2 | 0.883 | 0.596 | 0.789 | 0.393 | 4.88% |
| proventra mdeberta | 0.843 | 0.649 | 0.821 | 0.610 | 21.83% |
| protectai v2 | 0.820 | 0.599 | 0.816 | 0.614 | 8.82% |
| meta prompt-guard v2 | 0.810 | 0.312 | 0.771 | 0.214 | 0.77% |
| deepset injection | 0.766 | 0.696 | 0.787 | 0.704 | 65.89% |
| fmops distilbert | 0.700 | 0.659 | 0.765 | 0.712 | 64.98% |
| meta prompt-guarddeprecated — superseded by Prompt-Guard-2 | 0.314 | 0.594 | 0.705 | 0.640 | 88.30% |
Direct and indirect averages are unweighted across datasets. FPR@0.5 is averaged across WildChat and LMSYS real traffic. Default sort: direct avg AUC (descending). Click column headers to re-sort.
Detection ROC curves
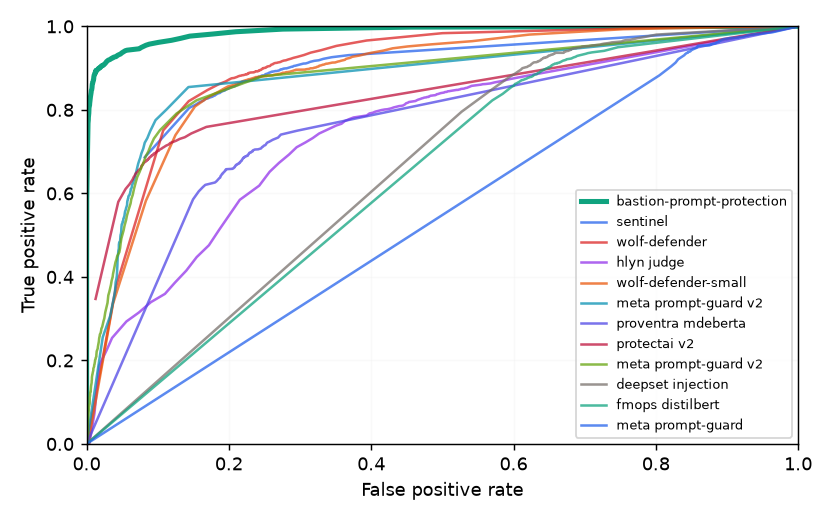
Curves plot TPR vs FPR from pooled direct-attack scores (sample-weighted across the four detection datasets). Table averages above are unweighted per dataset — see methodology for the distinction.
View methodology View source code View raw results View change history
Reproducibility
The published run manifest contains the model identifiers, immutable revisions, label mappings, dataset versions, runtime dependencies, and scoring configuration used for this release.
Minor differences may still occur across hardware, numerical libraries, or model-serving implementations. Any known sources of nondeterminism are documented in the methodology.
How to interpret these results
No single metric fully describes the quality of a prompt-injection detector. A model with strong aggregate discrimination may still produce too many false positives at a practical operating threshold, perform poorly on indirect attacks, or degrade on longer inputs.
Comparisons should therefore consider several metrics together.
Area under the ROC curve
ROC AUC measures how well a detector ranks malicious examples above benign examples across all possible decision thresholds.
- A value of 1.0 represents perfect ranking.
- A value of 0.5 represents performance equivalent to random ranking.
- Higher values are better.
ROC AUC is useful for comparing overall discrimination, but it does not identify the threshold that should be used in production.
Area under the precision–recall curve
PR AUC summarizes the trade-off between precision and recall across decision thresholds.
It is particularly informative when malicious and benign examples are imbalanced. Unlike ROC AUC, PR AUC depends on the proportion of positive examples in the evaluation dataset, so values from datasets with different class balances should not be compared directly.
Higher values are better.
Recall
Recall, also called the true-positive rate, is the proportion of malicious examples correctly detected.
Higher recall means fewer attacks are missed. Increasing recall often requires accepting more false positives.
Precision
Precision is the proportion of flagged examples that are actually malicious.
Higher precision means that a larger share of alerts are valid. Precision depends on the prevalence of attacks in the evaluated data and may differ in production.
F1 score
F1 is the harmonic mean of precision and recall at a specified decision threshold.
Higher values are better. F1 gives equal weight to precision and recall, which may not reflect the relative costs of missed attacks and false alarms in a specific application.
False-positive rate
False-positive rate, or FPR, is the proportion of benign examples incorrectly classified as malicious.
Lower values are better. Even a seemingly small FPR can create substantial operational burden when benign traffic greatly exceeds malicious traffic.
FPR at a fixed recall
FPR at 95% recall reports the false-positive rate at the threshold required to detect 95% of malicious examples in the evaluated dataset.
This metric helps compare detectors at a common security target. Lower values are better.
It should not be interpreted as a guarantee that the same recall or false-positive rate will occur on different traffic.
Direct-injection performance
Direct-injection results measure detection of malicious instructions supplied directly in user-controlled input.
These results should not be assumed to represent performance against instructions embedded in documents, web pages, emails, tool outputs, or retrieved context.
Indirect-injection performance
Indirect-injection results measure detection of malicious instructions embedded in content that an application may retrieve or process.
This category may include documents, web content, messages, tool responses, or other externally supplied context. Higher values are better, but performance may vary significantly by content format and context length.
Real-traffic false positives
The benign-traffic evaluation measures how often ordinary, non-malicious inputs are incorrectly flagged.
This dataset is intended to approximate practical false-positive behavior. It may not represent the language, domain, formatting, or traffic distribution of a particular deployment.
Choosing a detector
Benchmark results should be validated on representative application traffic before production use.